Your customers can see the environmental impact of the equipment you handle for them, on your Customer Portal, without asking you for a report: the weight you processed, what happened to it, and the estimated CO₂e (carbon dioxide equivalent, the standard measure of greenhouse gases) avoided by re-using and recycling it.
This article covers what your customers see, how to switch the dashboard on for everyone or customer by customer, the one money figure it can show, and how to see it exactly as a customer does before you switch it on. How the figures themselves are calculated is covered in ESG in Recycly: CO₂e avoided, counted automatically (opens in a new tab).
1. What your customers see
Once it is switched on, the portal home page gains an ESG card, third along after Jobs and Collections / Drop-offs, described as "Your recycling and carbon impact: weights, outcomes and estimated CO₂e avoided", with a View ESG Dashboard button. The page it opens is headed Your ESG dashboard and shows seven figures for the period chosen, plus an eighth for customers you have opted in:
- Total Weight Processed (kg), Landfill Diversion (%), Re-use Rate (%) and Hazardous Weight Handled (kg)
- CO₂e Avoided (kg, with the split between re-use and recycling beneath it), Devices Processed and Devices Remarketed
- Value Returned, only for customers you have opted in (see section 4)
Beneath the figures sit four everyday equivalents of the CO₂e avoided: cars off the road for a year, tree seedlings grown for 10 years, return flights London - New York, and UK homes' electricity for a year. They use exactly the same constants as the Environmental Impact Report, so a customer never sees two different numbers for the same thing.
The filters along the top are a period (Last 12 Months is the default, then This Year, Last Year, All Time and Custom... for a from and to date), Asset Type, Outcome (Preparation for re-use, Recycling, Other recovery or Disposal, the categories used by GRI 306 and ESRS E5-5) and, only where the customer has more than one site, Site.
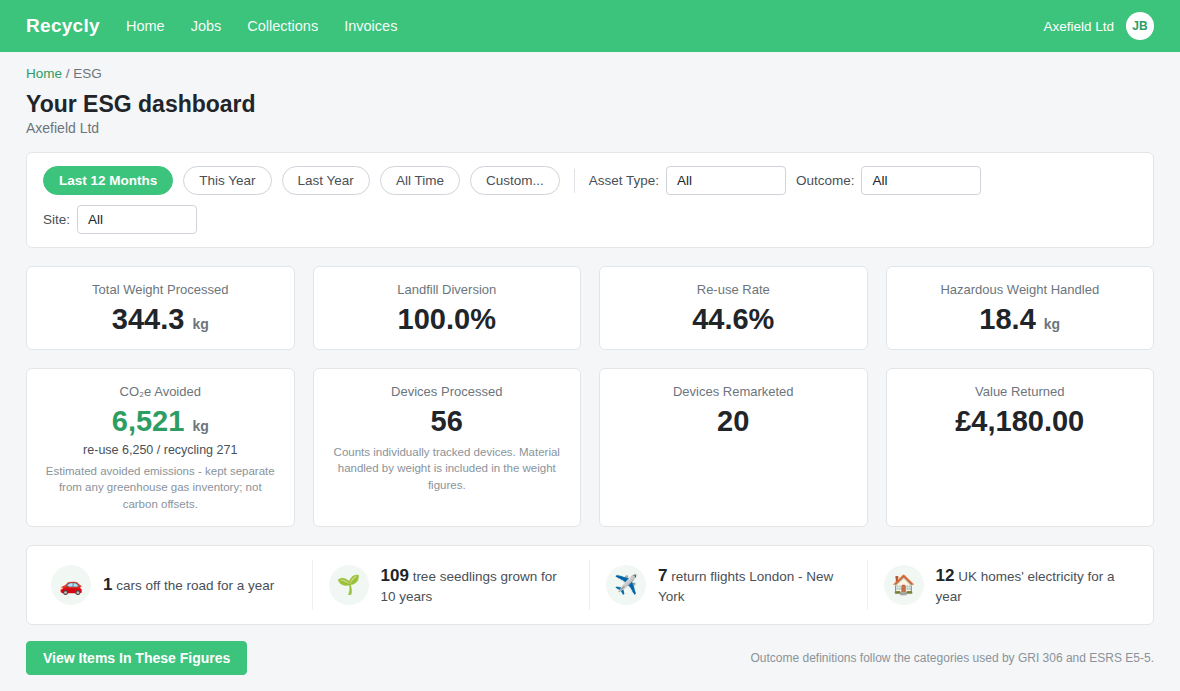
View Items In These Figures opens a list headed Items in your ESG figures: every completed item behind the figures currently shown, 50 to a page, with Item ID, Asset Type, Manufacturer, Model, Outcome, Qty, Weight (kg) and CO₂e Avoided (kg). The quantity always states its unit, so 46 kg of mixed WEEE (Waste Electrical and Electronic Equipment) reads as "46.00 kg" and never as 46 devices.
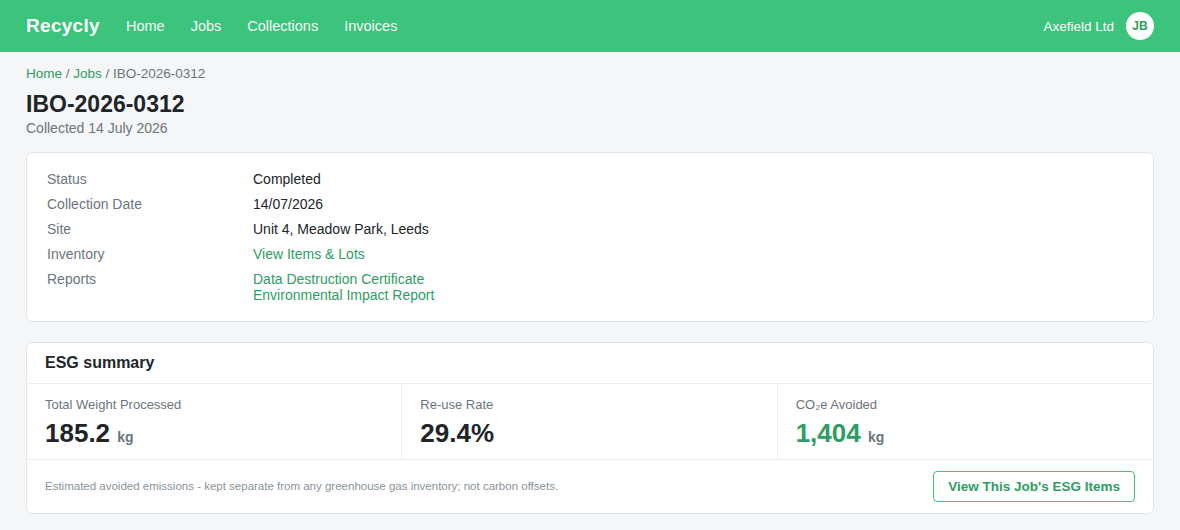
Each job page on the portal also gains an ESG summary card at the foot, with that job's Total Weight Processed, Re-use Rate and CO₂e Avoided and a View This Job's ESG Items button. The card only appears once the job has at least one completed item.
2. Switching it on (administrators)
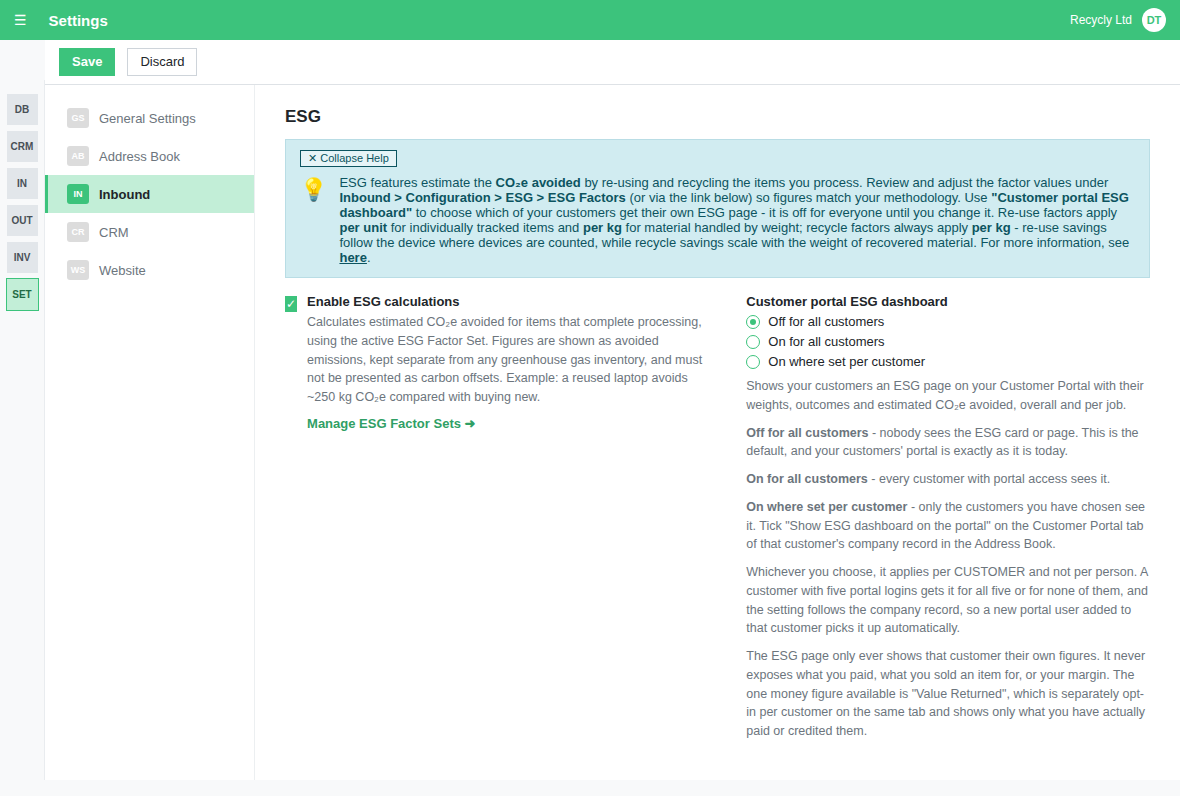
On a new system the dashboard is off until you switch it on. Go to Settings > Inbound > ESG. Beside the Enable ESG calculations toggle (beneath it on a narrow screen), and only while that toggle is on, sits Customer portal ESG dashboard with three choices:
- Off for all customers - nobody sees the ESG card or page. This is the default, and your customers' portal is exactly as it is today.
- On for all customers - every customer with portal access sees it.
- On where set per customer - only the customers you have chosen see it, using the tick described in section 3.
If you had the earlier single tick "Show ESG dashboard on the customer portal" switched on, the upgrade carried that forward as On for all customers, so check which option is selected before assuming your customers cannot see it.
Whichever you choose, it applies per customer and not per person. A customer with five portal logins gets it for all five or for none of them, and because the setting follows the company record, a new portal user added to that customer picks it up automatically.
When a customer cannot see the dashboard there is nothing to find: the card is absent from their portal home and the page address itself answers "not found", never an empty page or a page of zeros.
3. Choosing customers one at a time (administrators)
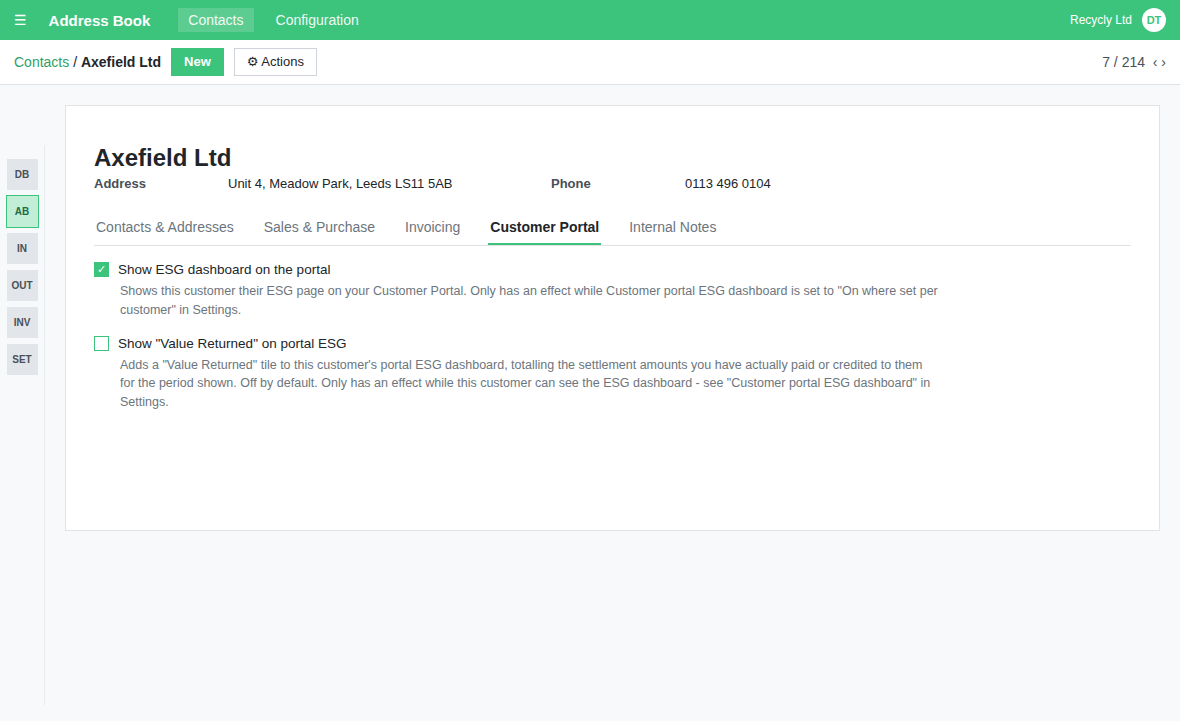
With the setting on On where set per customer, open the customer's company record in the Address Book (not one of its contacts) and go to the Customer Portal tab. Tick Show ESG dashboard on the portal and save. Every portal user of that company sees the dashboard from their next page load; untick it and it disappears for all of them.
Only an administrator can change the tick, and every change is recorded in the record's log, so you can always see who switched a customer on and when. The tick has no effect while the setting is on either of the other two options.
4. "Value Returned", and why your margin is safe
The dashboard is about weights, outcomes and carbon. It never shows what you paid for an item, what you sold it for, or your margin, and it only ever shows a customer their own figures.
The one money figure it can show is Value Returned, and it is off for every customer until you turn it on. On the same Customer Portal tab of the customer's company record, tick Show "Value Returned" on portal ESG. The tile then adds up your confirmed settlements with that customer whose settlement date falls in the period shown: the amounts you paid or credited them for their equipment, before tax, in other words their own money back. It is not gross resale value, so your remarketing margin is never exposed. It needs your Settlements feature to be on, and it only applies while that customer can see the dashboard.
When Value Returned is hidden, the CO₂e Avoided tile widens to fill the space, so the customer never sees an empty slot.
5. Seeing it as your customers do (staff)
You do not need a customer login to check what the dashboard will show. Sign in to your Customer Portal with your own staff login and you are treated exactly as a portal user of your own company would be. An amber banner at the top of the page reads "Staff view. You are signed in as staff, seeing this page exactly as a portal user of this company would." followed by the current setting and what customers can see.
- Under On for all customers, staff see the dashboard like everyone else.
- Under On where set per customer, staff see it only if your own company's record in the Address Book has Show ESG dashboard on the portal ticked. Tick it to preview, exactly as you would for a customer.
- Under Off for all customers, nobody sees it, staff included.
Staff see your own company's figures, not a customer's. To check a particular customer's dashboard, impersonate one of their portal users.
6. The Setup Assistant reminder
Because the dashboard is off by default, the Setup Assistant carries an item called Show your customers their ESG dashboard under Website & Portal Setup, so nobody has to know to go looking in Settings. It opens the Inbound settings page, where the ESG section described in section 2 sits.
7. Things worth knowing
- Nothing is calculated on the page. Every figure comes from the values stamped on each item when its processing completed, so changing a factor set moves nothing on the portal until an administrator runs Recalculate ESG figures.
- Only items whose processing is Completed are counted. Work in progress never appears, however far along it is.
- Devices Processed, Devices Remarketed and Re-use Rate count individually tracked devices only. Material handled by weight, such as mixed WEEE bought in kilograms, is included in the weight figures instead, and the small print under Devices Processed says so.
- If nothing matches the filters a customer has chosen, whether the period or an asset type, outcome or site with no completed items, the page says "No ESG data yet for this period" rather than showing zeros.
- The dashboard works on a phone: the figures stack in one column and the date boxes for a custom period get their own line.
- You can also let customers download the Environmental Impact Report for a job from its portal page. That is a separate switch on the report's Document Template, covered in ESG reporting: the ESG Summary and the Environmental Impact Report (opens in a new tab).
A note on the numbers
These figures are estimates of avoided emissions: the emissions that did not happen because a device was re-used or a material recycled instead of made from scratch. They are kept separate from any greenhouse gas inventory and must not be presented as carbon offsets. Your customers see the same reminder on the dashboard itself, under the CO₂e Avoided figure.