Recycly User & Setup Guides
< Back to Article ListESG reporting: the ESG Summary and the Environmental Impact Report
Last updated: 2 September 2026 at 12:31:37 UTC by Dom Tyler
Every item that completes processing carries its own stored ESG (Environmental, Social and Governance) figures: its weight, its outcome and the estimated CO₂e (carbon dioxide equivalent) avoided by re-using or recycling it. This article covers the two ways you turn those item figures into something you can show a customer: the ESG Summary for your own analysis and export, and the Environmental Impact Report, a Word document for a single job or for everything you did for a customer over a period.
How the item figures are calculated is covered in ESG in Recycly: CO₂e avoided, counted automatically, and what your customers can see for themselves on the portal in Customer portal ESG dashboard: switching it on and what your customers see. Both reports below only appear while Enable ESG calculations is on under Settings > Inbound > ESG.
1. The ESG Summary
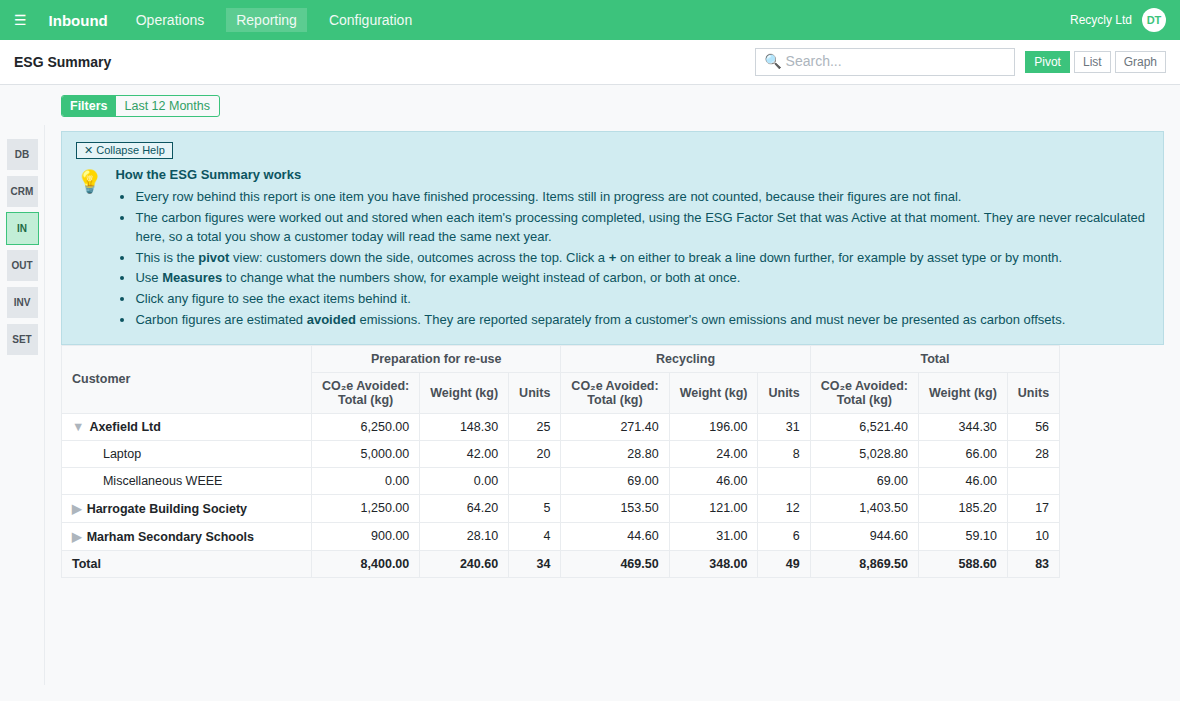
Inbound > Reporting > ESG > ESG Summary opens a pivot table with your customers down the side, one column per outcome (Preparation for re-use, Recycling, Other recovery and Disposal, the categories used by GRI 306 and ESRS E5-5) and three measures shown by default: CO₂e Avoided: Total (kg), Weight (kg) and Units. Every row behind it is one item you have finished processing; work in progress is not counted.
- The Filters menu offers Last 12 Months (on by default), This Year, Last Year and a Custom Range, plus Re-use only, Recycle only and Hazardous only.
- Group By reorganises the rows by Customer, Inbound Order, Asset Type, Outcome or Month. Click a + on a row or column heading to break it down further, and use Measures to change which numbers show: it also offers Weight: Actual (kg), Hazardous Weight (kg) and the CO₂e split between Re-use and Recycle.
- Click any figure to see the exact items behind it. The list shows the Item/Lot, Customer, Job ID, Asset Type, Outcome, Units, Measured By, Weight (kg), CO₂e Avoided: Total (kg) and Processing Completed, with optional Weight Source, Hazardous and Factor Set columns behind the small icon at the far right of the headings.
- The icons at the top right switch between the pivot, that list and a graph. Your filters carry across, and a line chart grouped by Month is the quickest way to see a trend.
Units and weight are never added together. The Units column counts individually tracked items only; material handled by weight, such as mixed WEEE (Waste Electrical and Electronic Equipment) bought in kilograms, shows no unit count and its quantity sits in the Weight (kg) column instead. So 46 kg of mixed WEEE is 46 kilograms recycled, never 46 units.
2. Exporting the data for a customer
On the list view of the ESG Summary, Export ESG Data (CSV) downloads exactly what your filters currently show as a spreadsheet your customers can drop into ESG questionnaires such as EcoVadis and CDP, or into their own Scope 3 tools. The rows are grouped by Customer, Period (the month, written as YYYY-MM) and Outcome, with columns Units, Weight kg, Hazardous Weight kg, CO2e Avoided Re-use kg, CO2e Avoided Recycling kg, Factor Set (every set used in that group) and Weight Source % actual, the percentage of the weight that was actually measured rather than estimated.
3. The Environmental Impact Report for a single job
Open the Inbound Order and choose Environmental Impact Report (listed as "Environmental Impact Report (Word document - editable download)") from the Documents menu at the top of the screen, the same menu every other document in the system is produced from. The report covers every completed item on that job, whenever it was finished.
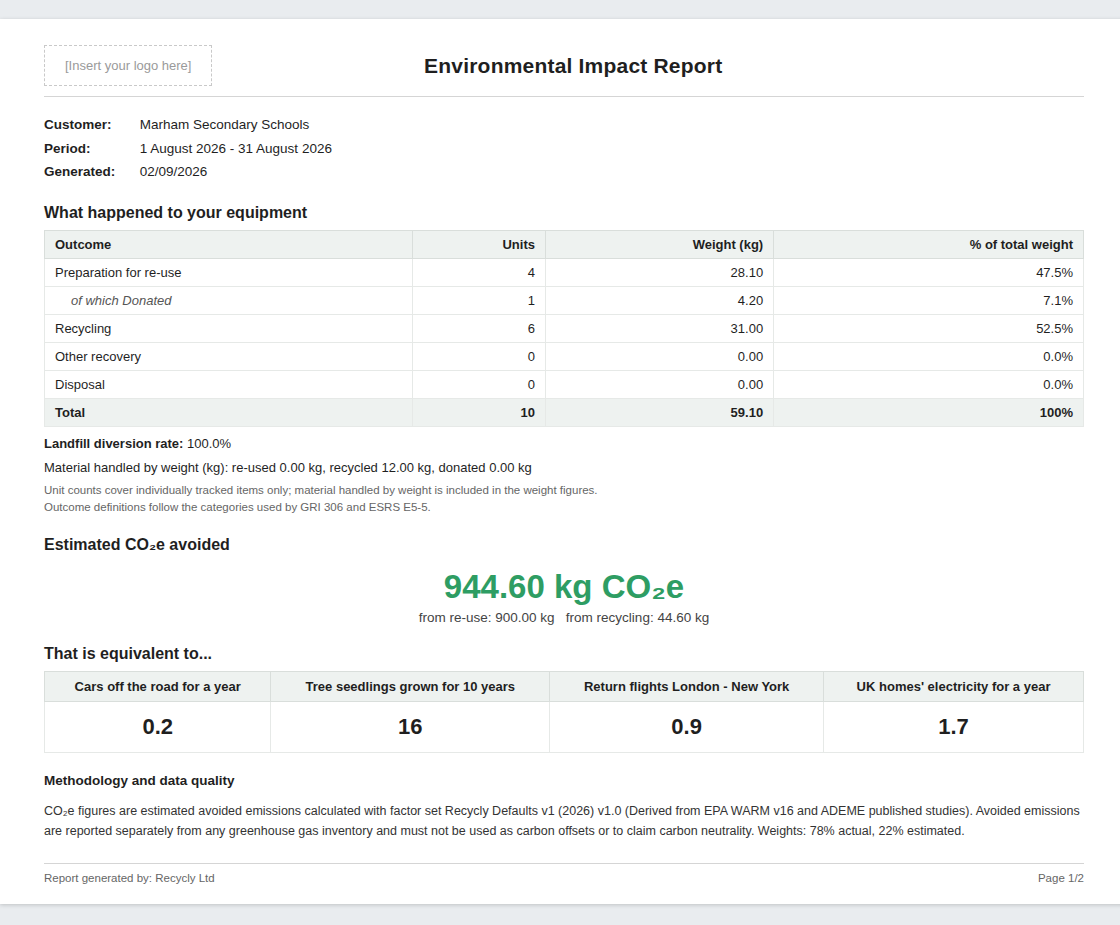
The document is A4 landscape Word, with your logo placeholder and the title in the page header and "Report generated by" plus page numbers in the footer. It contains:
- the customer, the job, the period covered and the date generated
- What happened to your equipment: one row per outcome with units, weight and percentage of total weight, a total row, the landfill diversion rate, and the material handled by weight shown separately in kilograms
- Estimated CO₂e avoided: the headline figure with its split between re-use and recycling
- That is equivalent to...: cars off the road for a year, tree seedlings grown for 10 years, return flights London - New York, and UK homes' electricity for a year, using the same constants as the portal dashboard
- Methodology and data quality: which factor set the figures were calculated with, and what share of the weights were measured rather than estimated
4. The Environmental Impact Report for a customer and a period
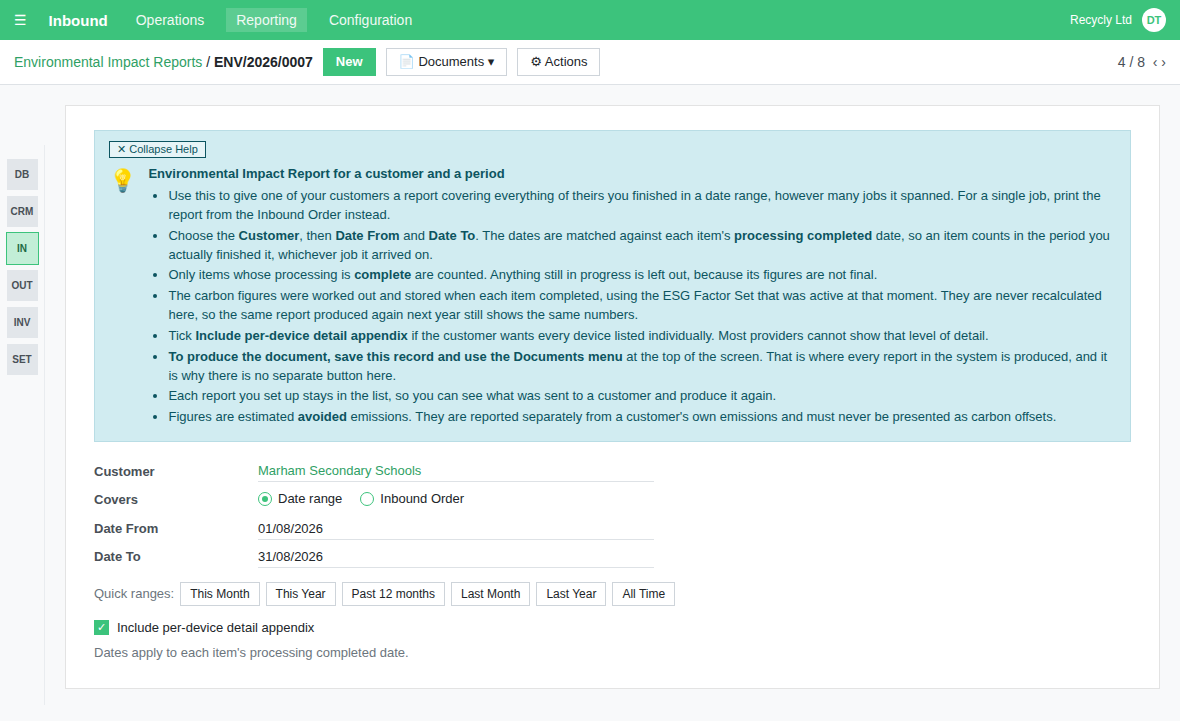
For everything you did for a customer over a period, however many jobs it spanned, go to Inbound > Reporting > ESG > Environmental Impact Report and click New.
- Choose the Customer. Only companies are offered, not individual contacts.
- Under Covers, pick Date range or Inbound Order. The same screen can therefore produce a single-job report as well, if you would rather keep a record of having sent it.
- For a date range, set Date From and Date To, or use the Quick ranges buttons beneath them: This Month, This Year, Past 12 months, Last Month, Last Year and All Time. The dates are matched against each item's processing completed date, so an item counts in the period you actually finished it, whichever job it arrived on.
- If the customer has sites and the report covers a date range, a tick appears under Customer reading Include N sites in the report (N being how many sites they have). Tick it to add the sites' jobs to the figures; left unticked, the report covers the customer and its own contacts but not its sites. Your choice is remembered for your next report.
- Tick Include per-device detail appendix if the customer wants every device listed individually, with its outcome, quantity, weight and CO₂e avoided and a totals row. Most providers cannot show that level of detail.
- Save. There is deliberately no Generate button: as with every other document, produce it from the Documents menu at the top of the screen. To email it, use Send message in the log below the form: the Send Message window opens with Include Report(s) ticked for you, and the report is generated and attached at the moment you send.
Each report you set up is given a reference such as ENV/2026/0007 and stays in the list, and a note is added to its log every time the document is produced, so you can always see what a customer was sent and produce it again.
5. Making the report your own (administrators)
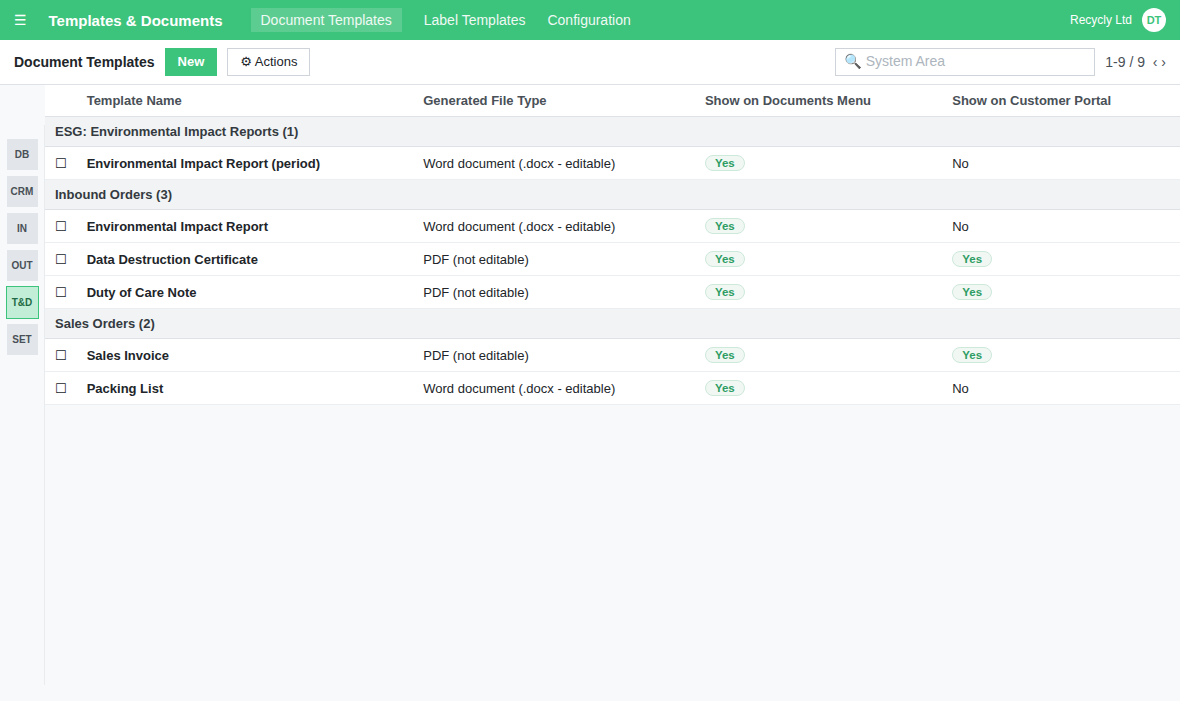
The Environmental Impact Report is a Document Template like your certificates, so you can put your own branding and wording on it. Go to Templates & Documents > Document Templates > Document Templates: the job version sits under the Inbound Orders area and the period version under ESG: Environmental Impact Reports. Both use the same Word file with the same merge fields, so once you have customised one, upload the same file to the other.
Replace the "[Insert your logo here]" placeholder in the header with your logo, adjust the wording as you wish, and keep the merge fields. If your system has the PDF conversion service set up, you can set Generated File Type to PDF on the template; otherwise leave it as Word, which needs no extra service. Note that the automatic tidying of the finished document (removing whichever of the Job ID or Period lines does not apply, the blank Donated row and an empty appendix) only happens on Word output. Upgrades never overwrite a template you have customised.
6. Letting customers download it from the portal (administrators)
Customers can fetch the job report themselves. On the Environmental Impact Report Document Template under the Inbound Orders area, switch on Show on Customer Portal, choose the Customer Portal Action (download, open in a new tab, or open with the print dialogue) and save. It then appears under Reports on each job page of your Customer Portal, for every customer with portal access, whatever your ESG dashboard setting. It is off when the system is installed, and only the job version can be offered this way; the period report is for you to send.
Portal users always receive it as a PDF, converted from your Word template on the way out, so this needs the PDF conversion service set up on your system; without it the download fails with an error.
7. If the figures need refreshing (administrators)
Both reports read the figures stored on each item and never recalculate them, so a report produced again next year shows the same numbers as today. A stored figure changes only when an administrator runs Recalculate ESG figures from the Actions menu on the items or jobs, or when the item's Intended Final Action is corrected after it completed. A change to your ESG factors alone moves nothing, so run the recalculation first if you want a report to reflect new factors, as described in ESG in Recycly: CO₂e avoided, counted automatically.
A note on the numbers
These figures are estimates of avoided emissions: the emissions that did not happen because a device was re-used or a material recycled instead of made from scratch. They are kept separate from any greenhouse gas inventory and must not be presented as carbon offsets. The Environmental Impact Report says so in its methodology section, and the ESG Summary in its help panels, so the wording your customers receive is always the same.